

When U.S. and Israeli forces launched Operation Epic Fury against Iran in late February 2026, the Dow Jones Industrial Average (DJIA) reacted sharply, dropping more than 1,000 points in a single day, and roughly 2,440 points two weeks into the war, as Strait of Hormuz shipping froze and Brent crude surged toward $120 a barrel. This recent market turbulence has many investors asking: how does the Dow Jones perform during wars?
Markets often fear uncertainty first when conflicts erupt. War headlines trigger risk-off moves: equity selling, safe-haven flows into Treasuries or gold, and spikes in oil or defence stocks. Yet the Dow’s longer-term path has rarely been dictated by the “war” label alone. Performance hinged more on oil prices, inflation, interest rates, corporate earnings, fiscal responses, and the conflict’s threat to global trade
For investors reaching for historical parallels, a long record exists. The problem is that the record is more complicated than the headlines.
Markets Fear Uncertainty When Wars Break Out
The DJIA is a price-weighted index of 30 large U.S. blue-chip companies, meaning stocks with higher share prices carry more influence over the index’s movements than lower-priced ones.
That structure is a stress point in wartime because sector rotations, defence stocks rising, airlines and consumer names falling, can produce Dow movements that diverge from the broader S&P 500. What history shows consistently is that anticipated conflicts produce smaller immediate drops than surprise attacks.
An LPL Research review of “…20 major geopolitical events dating all the way back to World War II showed stocks had fully recovered losses within an average of 47 trading days after an average maximum drawdown of 5%.”
The more critical variable is not the conflict label. It is whether the conflict triggers an oil shock, a recession, or a lasting shift in inflation and interest rates.
Dow Jones Performance During the 2003 Iraq War
The 2003 invasion of Iraq is frequently cited as evidence that wars can rally markets. The specifics are more nuanced. By March 2003, months of pre-war speculation had already driven the Dow lower. When the invasion launched on March 19, the Dow rose 2.3% the next day, not because war was bullish, but because uncertainty had resolved into fact.
The DJIA gained 8.4% in the month following the invasion and finished 2003 up 21.5%. But those returns reflected the prior bear market, low inflation, and Federal Reserve rate cuts as much as they did the conflict. The economic starting point in 2003 was very different from today.
How the Gulf War Oil Shock Impacted the Dow Jones
The 1990–1991 Gulf War is a more sobering comparison, and arguably the more relevant one. When Iraq invaded Kuwait on August 2, 1990, WTI crude oil rose 90.2% between August 2 and October 11, while the Dow fell roughly 21% by October, its sharpest wartime decline since World War II. A recession had already begun in July 1990 before the invasion, and the oil shock accelerated the damage. Relief came once the military outcome became clear.
When Operation Desert Storm launched on January 17, 1991,oil prices crashed 33% on the day of the air campaign and the S&P 500 jumped 3.7%. The Dow crossed 3,000 for the first time in 1991 as supply fears abated. The lesson was not that war is good for markets. It was that resolution of the oil supply question mattered far more than the conflict itself, a fact that still holds in the ongoing U.S.-Israel-Iran war.
Older Wars Show No Simple Pattern
After Pearl Harbor on December 7, 1941, the DJIA fell 2.9% on the first trading day back. Following the 9/11 attacks, markets closed for four days, the longest shutdown since 1933, and the DJIA fell 7.1% when trading resumed on September 17, 2001. Both were surprise attacks. Both were followed by partial recoveries as investors adjusted to a new reality.
During the eight years of active U.S. involvement in Vietnam, the Dow Jones posted solid cumulative gains rather than sustained losses. Market history shows that the most severe damage came in 1973–1974, when the Arab oil embargo following the Yom Kippur War coincided with a brutal bear market that sent the Dow sharply lower. In fact, during the 1973–1974 period, “the Dow Jones Industrial Average (DJIA) lost 43% of its value,” per Investopedia.
That episode highlights a broader historical pattern: the deepest modern-era equity losses have tended to coincide with major oil supply disruptions.
The Organization of the Petroleum Exporting Countries (OPEC) embargo was the clear trigger in 1973–74, when oil prices quadrupled (from $3-$12 per barrel) and markets plunged. By contrast, conflicts that did not materially threaten global energy supplies have generally resulted in more contained and shorter-lived drawdowns.
Why the 2026 Iran Conflict Is Different for Investors
The current conflict sits in a different category from the 2003 Iraq War. The Strait of Hormuz handles roughly 20% of global oil flows, and its disruption since late February 2026 has driven U.S. gas prices up more than 50% since the war began. The International Energy Agency (IEA) characterised the supply shock as the largest in the history of the global oil market.
WTI crude has traded above $100 per barrel for extended periods in April and May. The 10-year Treasury yield climbed above 4.4% as bond markets priced in sustained energy-driven inflation, a significant move from the 3.97% recorded just before the strikes began.
The 2026 economic backdrop more closely mirrors 1990 than 2003. GDP growth had already slowed before the strikes began. Inflation remained above the Federal Reserve’s target. Goldman Sachs raised its 12-month U.S. recession probability to 30%.
In 1990, the oil shock struck a fragile economy with rates elevated and credit constrained. In 2003, it struck one recovering from a bear market with rates falling. The current combination of elevated energy prices, high bond yields, and slowing growth creates a distinctly different risk profile from either precedent.
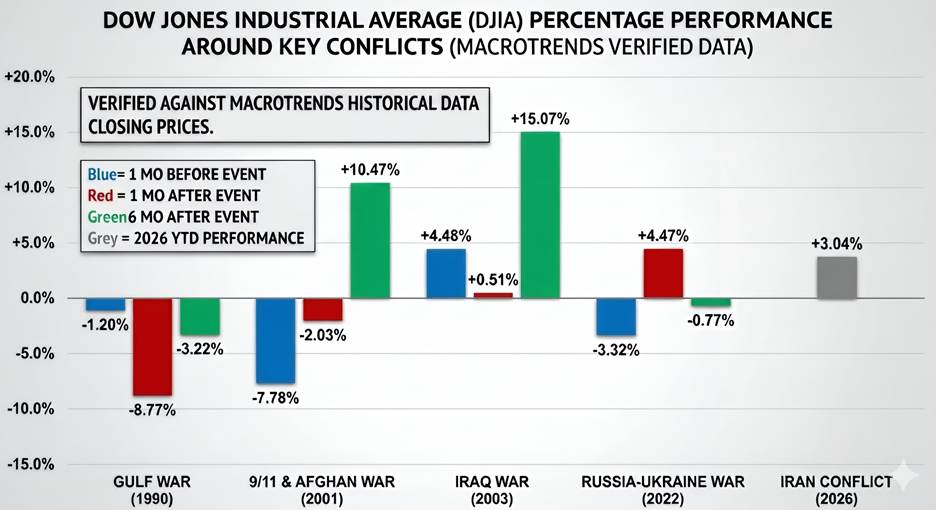
Verified historical war records (closing prices). Source: Macrotrends
What Investors Should Not Conclude
Past wartime Dow performance is context, not a trading rule. Wars differ. Oil exposure differs. Starting valuations differ. The Dow has historically recovered from military shocks faster than investors expect at the moment of peak uncertainty. But the Gulf War produced the largest wartime Dow drawdown in the modern era precisely because oil supply was the underlying problem.
In 2026, oil supply is again central. The question investors should be asking is not “war or no war?” It is whether the Iran conflict changes inflation, Federal Reserve policy, corporate earnings, and global trade in ways that outlast the ceasefire. History says that resolution of the oil supply problem, not the conflict itself, is what ultimately determines the recovery.
The direction of the Dow from here depends less on any precedent from 2003 and more on what happens in the Strait of Hormuz.
Author: Richardson Chinonyerem
The editorial team at #DisruptionBanking has taken all precautions to ensure that no persons or organisations have been adversely affected or offered any sort of financial advice in this article. This article is most definitely not financial advice.
See Also:

Richardson Chinonyerem
Contributing author at Disruption Banking, covering capital markets.