The Dow Jones Industrial Average (DJIA) has officially crossed the historic 50,000 milestone, closing above this key level on May 14. This marks the first time the blue-chip index has traded above 50,000 since February, arriving at a time when the S&P 500 and Nasdaq are also setting fresh record highs.
After sharp declines earlier in 2026 triggered by the Iran conflict, the Dow has lagged its peers for much of the year but is now catching up. As the November midterm elections approach, investors are turning to history for clues: How has the Dow Jones performed in past midterm election years? What can previous cycles tell us about potential market volatility, returns, and risks heading into the vote?
The historical data offers useful context, but far less predictive power than many headlines claim. Here is what the record actually shows about Dow Jones performance in midterm years and what it may mean for 2026.
Midterm Years Bring Slower Gains and Volatility
A midterm election is held in the second year of a U.S. president’s four-year term, when every House seat and a third of Senate seats are contested. Control of Congress can shift, and with it, the trajectory of tax, spending, trade, and regulatory policy. Markets tend to price that uncertainty before they price the result.
The historical pattern is consistent enough to have a name. According to data from the Stock Trader’s Almanac going back to 1896, the DJIA has averaged a price return of approximately 4% in midterm election years, compared with roughly 10.2% in pre-election years and 6% in presidential election years. LPL Research noted in March 2026 that midterm years have historically delivered average returns roughly five percentage points below the other three years of a presidential term, with volatility often intensifying in the six months before election day.
That is not the same as saying the market falls. It means the Dow has historically grown more slowly in midterm years, with sharper intra-year swings.
Dow Jones Versus S&P 500 in Election Analysis
Before reading too much into any midterm pattern, the index itself is key.
S&P Dow Jones Indices describes the DJIA as a price-weighted measure of 30 blue-chip U.S. companies, covering all major sectors except transportation and utilities. Price-weighted means stocks with higher share prices have more influence on the index’s movement than their economic size might justify. The S&P 500, by contrast, covers 500 companies weighted by market capitalisation, a much broader read on the U.S. economy.
When researchers cite midterm election market data, they are usually drawing on S&P 500 history, which stretches further and covers more companies. Capital Group’s midterm election analysis, for example, reviewed more than 90 years of S&P 500 data, useful context for broad U.S. equity markets, but not the same as Dow-only data. The distinction is important when drawing conclusions specific to the DJIA.
What Recent Midterm Years Show for Dow Returns
Recent midterm years have delivered a mixed result for the Dow, and that inconsistency is precisely the point.
According to historical annual return data from Macrotrends, the Dow gained approximately +11% in 2010 and around +7.5% in 2014, both midterm years, both positive. The two most recent midterm years were losses: the Dow fell approximately -6% in 2018 and -8.8% in 2022.
In both cases, macro forces dominated. In 2018, the U.S. Federal Reserve was raising rates aggressively and trade tensions with China were escalating. In 2022, the Fed launched its most aggressive tightening cycle since the 1980s in response to post-pandemic inflation. The election calendar was a secondary variable in each.
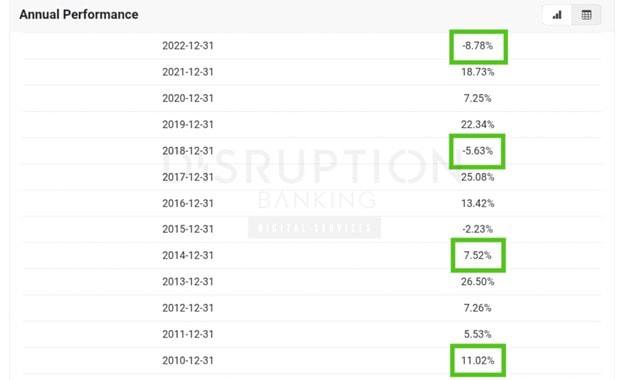
Source: Macrotrends
The 2002 midterm year, the aftermath of the dot-com bust, 9/11, and early recession, saw the Dow record one of its sharpest annual losses of the modern era. The 2006 cycle, by contrast, saw the Dow post strong gains as the economy grew and corporate earnings held up. No consistent direction emerges from the raw data. The facts of data are clear on that.
Why Markets Struggle Before Midterm Elections
Pre-midterm uncertainty is real, even if its market impact is overstated. Investors may not know whether corporate tax rates will change, how energy policy will shift, or which trade rules will be rewritten if congressional control moves.
That uncertainty can suppress risk appetite and widen volatility in the months leading up to election day, even when no major policy change ultimately materialises.
Post Midterm Market Recovery Patterns
Once the result is known, the uncertainty that compressed markets tends to ease. Data reviewed by MUFG from Bloomberg shows that the S&P 500 has advanced in the twelve months following every U.S. midterm election going back more than 80 years, with an average gain of around 6.3% in the three months immediately after the vote. The recovery tends to begin before election day itself, as positioning shifts and uncertainty lifts.
The caveat from U.S. Bank investment strategists is clear: this pattern is not statistically robust enough to treat as a trading rule. Which party wins, which party loses, and how Congress divides generally has not been a reliable predictor of overall equity performance. One variable rarely explains equity markets.
Why 2026 May Differ for the Dow Jones
The Dow’s return above 50,000 this week masks a more complicated year. The S&P 500 and Nasdaq erased their Iran war losses by mid-April and hit consecutive records in recent weeks, driven by AI infrastructure spending and a recovery in large-cap technology.
The Dow, with its concentrated composition of 30 blue-chip stocks and without the heavy weighting in high-growth technology names, has only now caught up. That structural gap is a reminder of how differently the same underlying economy can read across indexes.
The variables most likely to shape Dow performance through November are not primarily political. Import prices rose 4.2% year-on-year (YoY) as of April 2026, the highest since October 2022, keeping Federal Reserve rate cut expectations subdued.
Oil prices and the status of the Strait of Hormuz remain a live geopolitical risk in the Iran war. Earnings growth from AI-adjacent positions, particularly in industrial and financial components of the Dow, will matter more than vote tallies. And Disruption Banking’s own ongoing Dow Jones coverage has documented how geopolitical shocks and macro policy shifts have repeatedly overridden headline political narratives in shaping index performance.
None of those variables are on the November ballot.
History Is Context, Not a Forecast
The midterm election record is worth knowing. The Dow’s historically softer average return in midterm years, the tendency for intra-year volatility to concentrate before the vote, and the consistency of post-election recoveries in broader equity markets are all useful background for investors navigating 2026.
They are not a signal, and they should not be read as one. Two of the last three midterm years produced Dow losses, not because of the elections, but because of central bank tightening, trade shocks, and recession risk. In 2026, those same forces are still active.
The November result will influence sector-level outcomes, particularly in energy, financial services, and technology regulation. Whether it shapes the Dow’s annual return is a far more uncertain question, and one that earnings, rates, and oil prices may already be answering.
Author: Richardson Chinonyerem
See Also:
How Can a Company Join the Dow Jones? | Disruption Banking
Are Dow Jones Components Targets for Activist Hedge Funds? | Disruption Banking