
The phrase is already circulating again. Every influencer, analyst, and chart-watcher is warming up to the same seasonal script: “sell in May and go away.” It is a 200-year-old Wall Street adage born on the London Stock Exchange (LSE) during a time when English aristocrats would leave the city each summer, and trading volumes would collapse with them. That is the rule’s entire intellectual foundation, 18th/19th-century lords on holiday. Applying it to 2026 is intellectually lazy.
The complete phrase, an old English saying, “Sell in May and go away, and come on back on St. Leger’s Day,” a reference to the September horse race in England, sounds clever, but the data does not support treating it like a rule, or some sacred market signal.
It’s a Myth: “Markets Do Not Repeat Themselves”
Today, the S&P 500 and the Dow Jones Industrial Average (DJIA) are the markets everyone uses to test whether the saying still deserves respect.
In 11 out of 14 years since 2011, selling in May meant missing a positive June and July, in the very market the rule was invented for. Jonathan Golub, chief U.S. equity strategist at Credit Suisse (now UBS), dismissed the logic bluntly in a CNBC report: “Any investment strategy that you can summarize in a rhyme is probably a bad strategy.” His point was simple. Markets do not repeat themselves just because the calendar says May. As he put it, the idea would only make sense “if every single May looked the same as the May the year before.”
Stephen Suttmeier, technical research strategist at Bank of America, found that the S&P 500’s May-to-October period was positive 66% of the time going back to 1928, with an average return of 2.2%. His conclusion was sharper than the old rhyme: “Instead of ‘sell in May and go away’ it should be ‘buy in May and sell July/August.’”
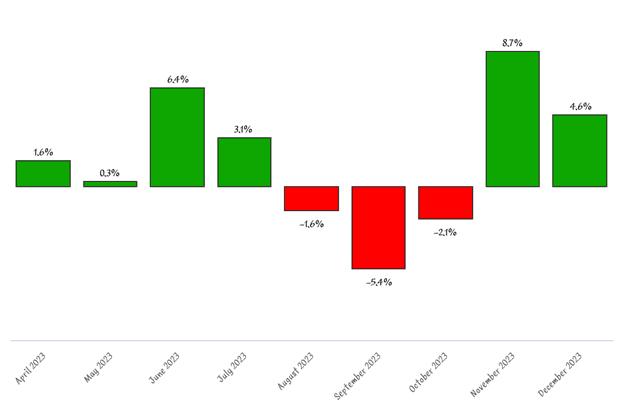
The 2023 market cycle made the danger obvious. Anyone who sold in May missed a major part of the AI-led rally. YCharts shows the S&P 500 returning 0.25% in May 2023, 6.47% in June, and 3.11% in July. StatMuse’s data is slightly different for May and June, showing 0.31% and 6.39%, but it confirms the same core point: July returned 3.11%, and the summer rally was real.
The Dow Jones data makes the same point. Carter Worth, chief market technician at Cornerstone Macro, found that from 1896 to 2020, the Dow’s average return was stronger from November to April, at 5.2%, than from May through October, at 2.1%, per a CNBC report.
But even Worth rejected the idea of blindly exiting the market. His bigger finding was devastating for the adage: $1 million invested only during November-to-April periods going back to 1896 would have grown to $164.4 million, while staying invested all year would have grown to $672.6 million.
Seasonality Works, But Blindly Selling in May Doesn’t
That does not mean seasonality is fake. The November-to-April period has historically been stronger than May-to-October. Even Stock Trader’s Almanac argued that from 1950 through April 2021, the S&P 500 averaged 7.2% in the “best six months” versus 1.6% in the “worst six months.” But even that evidence does not justify treating May as an automatic sell signal.
Barry Bannister, Stifel’s head of institutional equity strategy, made the essential caveat in a related seasonal discussion: “investing in all 12 months of the year” produced a much larger long-term outcome than seasonal switching alone.
The three years where it actually worked, 2011, 2015, and 2022, each shared one characteristic: a specific, identifiable macro catalyst, a named event driving the selloff. A debt ceiling standoff. China slowdown fears. The fastest Federal Reserve rate-hiking cycle in 40 years. At best, in 2026, “sell in May…” is a 50-50 bet with asymmetric downside.
May Is One of Bitcoin’s Strongest Months
Bitcoin (BTC) was invented in 2009. It trades 24 hours a day, 365 days a year, across every timezone. It has no Hamptons, no seasonal trading lulls, and no aristocratic calendar. Applying an adage built around 19th-century travel schedules to this asset is analytically indefensible.
Ran Neuner, host of the YouTube channel @CryptoInsider, made this strong point in his latest analysis: “Bitcoin was invented in 2009, long after the 19th-century aristocrats went on holidays.” A stock-market rhyme should not be blindly imported into a global digital asset, he opined.
The historical data confirms it. Over the past 12 years, Coinglass heatmap shows BTC averaged around +8.18% return in May, and +7.6% in July. May is one of the four strongest months of the year for Bitcoin, alongside April, October, and November. The genuine seasonal weakness sits in June, where Bitcoin averages -0.14%, in August +1.12%, and in September, where it averages -3.08%. Nobody says “sell in September and go away” because it does not rhyme.
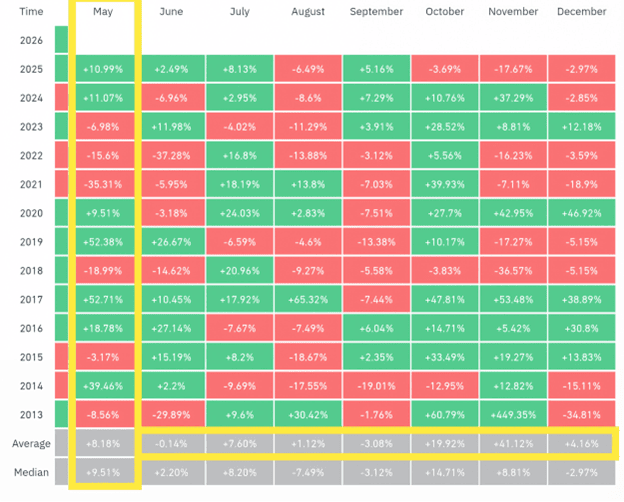
In 10 out of 15 years, investors who sold in May watched Bitcoin climb through June and July from the sidelines. As Ran put it in his YouTube video analysis after reviewing 15 years of data: “The old adage of sell in May borrows the logic of the 19th-century English aristocrats on their summer holidays and people try to project it on this 24/7 global digital asset that doesn’t take breaks and certainly doesn’t take summer holidays.”
Why Bad Mays Happen: Catalysts Not the Calendar
The reason “sell in May” sometimes works is not because May is cursed. It works when May carries a catalyst.
The most recent three years where selling May worked for Bitcoin, 2021, 2022, and 2023 (besides 2013, 2015, and 2018), each had catastrophic and largely unforeseeable catalysts. Elon Musk reversing Tesla’s Bitcoin policy simultaneously with China’s renewed mining crackdown in 2021. The Terra/Luna collapse erasing $40 billion in 48 hours, as contagion spread across Celsius, Voyager, and Three Arrows Capital, alongside the Fed’s most aggressive rate-hiking cycle in a generation in 2022. The SEC’s simultaneous lawsuits against Binance and Coinbase during peak regulatory winter in 2023.
“Every time sell in May was right, there was a catastrophic external supply shock. It was never the month. The month was never the catalyst,” Ran observed.
That is the point: the month was not the catalyst. The catalyst was the catalyst.
2026 Bitcoin Risks: Fed Chair Transition and US-Iran Tensions
At the time of writing, Bitcoin is trading near $76k roughly 41% below its October 2025 all-time high of a bit over $126k, while the S&P 500 and the Dow Jones sit at record levels over 7,160, and 49,200, respectively. The divergence between the three assets is historically wide.
CryptoQuant data shows whale wallets absorbed 270,000 BTC over the past 30 days, the largest single-month accumulation since 2013, as exchange reserves dropped to their lowest level since December 2017. Funding rates have been negative for 11 consecutive periods, the structural setup for a sharp short squeeze.
Three macro catalysts warrant attention. Jerome Powell’s Fed chairmanship expires this month, with Kevin Warsh expected to take over, though a Senate standoff over his confirmation could inject volatility ahead of his first FOMC meeting on June 17.
The US-Iran ceasefire negotiations remain unsettled; an escalation would reignite inflation fears and compress risk assets broadly. And Bitcoin’s decoupling from equities, unusual at this scale, could close violently if the current bear flag breaks upward.
These are live risks. But they are catalyst risks, not calendar risks. The data across both asset classes, across 15 years, has never supported the adage. As Ran concluded: “Trade the catalyst, not the calendar.” That is the only thesis the evidence has consistently endorsed.
Author: Richardson Chinonyerem
The editorial team at #DisruptionBanking has taken all precautions to ensure that no persons or organisations have been adversely affected or offered any sort of financial advice in this article. This article is most definitely not financial advice.
See Also:
The 7 Biggest Capital Markets Disruptors of 2026 (So Far) | Disruption Banking
BOOM BELT Revolution: Texas Stock Exchange Leads the Charge | Disruption Banking
The $1B Banana Feud: Justin Sun Sues the Trumps | Disruption Banking