


The Dow Jones Industrial Average (DJIA), an index of 30 American corporate giants, has charted a complex course from 2020 to April this year. Its performance within this five-year period is a good indicator of how financial markets respond to unprecedented shocks, policy interventions, and shifting geopolitics. The Dow’s trajectory over this time reflects both the enduring strength and underlying vulnerabilities of the modern financial system. To understand its recent history is to better anticipate the forces shaping future market cycles. It’s also a good place to analyze investment returns over the years.
In this piece, Disruption Banking examines the DJIA’s annual performance from early 2020 to 2025 and compares the DJIA’s annual performance over this five-year timeframe with the broader S&P 500’s performance.
2020-2023: The Pandemic and the Dow Jones
Five years ago, the DJIA faced one of its biggest tests. The COVID-19 pandemic triggered a dramatic sell-off, within a single week in March 2020 erasing over 12% (2,997.10 points) of the value of the DJIA. By year-end, it posted a 7.25% gain, closing at 30,606.48, supported by a $2.2 trillion stimulus package and through the CARES Act. In 2021, the DJIA showed a robust 18.73% return, reaching 36,338.30.
In 2022 things changed. Inflation in the U.S. peaked at 9.1%, with an annual average of 8.0% for the year. The Federal Reserve, led by Jerome Powell, raised interest rates to 4.00-4.5 percent by year-end. The Russia-Ukraine war rattled supply chains — especially in energy and agriculture — leading to an 8.78% loss. The DJIA closed the year at 33,147.25. In 2023 Gains returned (13.70%) and the same was the case in 2024 (12.88%), driven by stabilizing inflation and strong jobs reports.
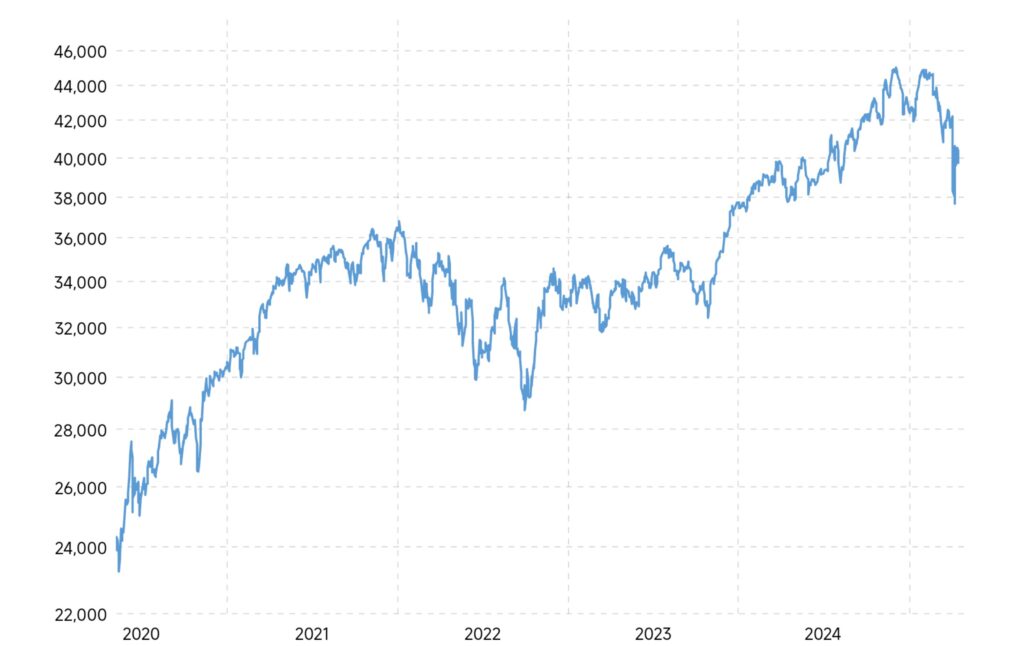
Chart showing the DJIA’s five-year performance, 2020-2025. Source: MacroTrends
2024–2025: Modern Trade Wars and the Dow Jones
In December 2024, the Dow notched an astonishing milestone, crossing the 40,000 mark for the first time. Markets were buoyant. Headlines celebrated the resilience of the American economy. Pundits speculated about a new bull market. But markets, like all things, have their limits.
Early 2025 brought a swift correction, pulling the Dow back by 6.76% year-to-date at 39,669.39 in April. Profit-taking, rising global tensions – especially the Trump ‘Liberation Day’ tariff, as reported by Disruption Banking — coupled with concerns about overvalued companies all contributed to the dip.
Corrections are a normal part of market cycles. However, the speed of the one day 5.5 percent decline of the DJIA, on April 4th, mirrored the speed of its earlier ascent. It also suggested that speculative excesses had once again outpaced fundamental reality. The market crash on April 4th combined with the performance since the turn of the year have led to the DJIA’s drop so far in 2025 of 6.76%.
The DJIA’s resilience through turbulent markets is remarkable. However, its volatility underscores its sensitivity to external forces. Unlike the market-cap-weighted S&P 500, the DJIA’s price-weighted structure gives higher-priced stocks, such as UnitedHealth, disproportionate influence. This can dampen volatility during crises, as blue-chip stocks often hold steady, but may limit gains in tech-driven rallies led by lower-priced, high-growth firms. Liquidity serves as both a driver and a limiter of performance. Consequently, the DJIA’s fortunes are closely tied to Federal Reserve policy, a boon when supportive but a vulnerability when tightening occurs.
Comparing the Dow Jones Against the S&P 500
Before comparing the DJIA’s performance with the S&P 500, it’s important to understand that the DJIA operates on a price-weighted index. Meaning companies with higher share prices have more influence on its movements. This is unlike the S&P 500 index, which is weighted by market capitalization. Owing to this structure, the Dow can sometimes behave differently to other market indicators.
To provide context, the S&P 500, comprising 500 leading U.S. companies, generally outperformed the DJIA over the last five years. Annual returns, according to MacroTrends data, are shown in the table below.
| Year | DJIA Annual % Change | S&P 500 Annual % Change |
| 2020 | 7.25% | 16.26% |
| 2021 | 18.73% | 26.89% |
| 2022 | -8.78% | -19.44% |
| 2023 | 13.70% | 24.23% |
| 2024 | 12.88% | 23.31% |
| 2025 | -6.76% (YTD) | -10.30% (YTD) |
2025 figures are YTD as of April, not full-year returns like shown for 2020–2024.
The S&P 500 showed higher gains in 2020, 2021, 2023, and 2024. A reflection of its broader base of companies it tracks. However, in 2022, the DJIA’s -8.78% decline was less severe than the S&P 500’s -19.44%. This suggests greater resilience among large-cap blue-chip companies during downturns. As of writing, both indices are negative, with the S&P 500 slightly worse at -10.30% YTD compared to DJIA’s -6.76%, indicating shared exposure to recent tariff impacts.
Economists at Goldman Sachs have predicted a 65% chance of a U.S. recession in the next 12 months. This could change to a better outlook if tariff talks go well.
What does the Future Hold for the Dow Jones?
According to S&P Global, The Dow Jones has provided a 10.06% annualized return since January 2020. It has endured a pandemic, inflation surges, and geopolitical shocks, proving its staying power. But endurance is not the same as invincibility. Recent tariff turmoil, coupled with potential inflation spikes, has been a major test for the DJIA. Upcoming and ongoing earnings reports will reveal whether DJIA firms can weather rising costs. The Fed’s next steps will shape liquidity, a linchpin for equity markets. Additionally, the Fed now needs to stave off the spectre of inflation.
Today, the market’s fate hinges on clarity — on trade, monetary policy, and global stability. The Dow has endured worse. Whether it thrives depends on navigating current uncertainty with the same grit it showed in the past.
Author: Richardson Chinonyerem
The editorial team at #DisruptionBanking has taken all precautions to ensure that no persons or organizations have been adversely affected or offered any sort of financial advice in this article. This article is most definitely not financial advice.
See Also:
How is the Dow Jones Responding to Reindustrialisation? | Disruption Banking
Will Trump’s Liberation Day Cause a Stock Market Crash? | Disruption Banking