


Cboe Global Markets capped 2025 with its sixth consecutive record year for options trading volume, totaling 4.6 billion contracts despite softer December activity.
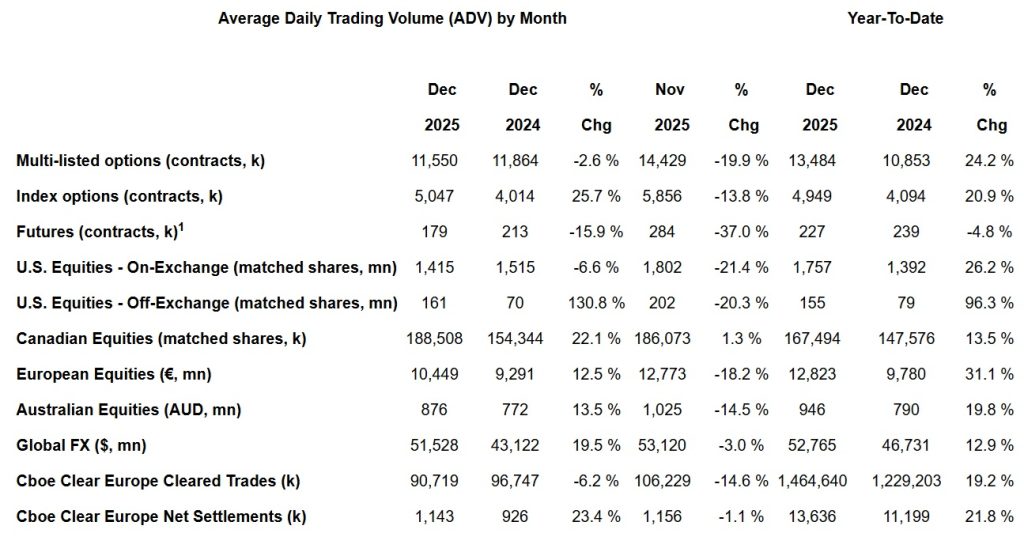
Average Daily Trading Volume (ADV) per month has increased in several areas. European equities are up 31% since 2024. Global FX increased almost 13% during the same period. Across the board growth is visible except Futures.
1 In the second quarter of 2025, Digital futures products were transitioned to Cboe Futures Exchange. Futures metrics prior to the second quarter of 2025 exclude Digital futures products.
Key 2025 Highlights:
U.S. Options
- Total volume traded across Cboe’s four options exchanges was 4.6 billion contracts in 2025, with an ADV of 18.4 million contracts traded, the sixth consecutive record-breaking year.
- Several additional yearly volume records were set in 2025, including:
- Multi-list options traded a total of 3.4 billion contracts across Cboe’s exchanges, with an ADV of 13.5 million contracts.
- Overall proprietary index options product suite traded a total of 1.2 billion contracts, with an ADV of 4.9 million contracts.
- S&P 500 Index (SPX) options traded a total of 970.6 million contracts, with an ADV of 3.9 million contracts.
- SPX zero-days-to-expiry (0DTE) options ADV record of 2.3 million contracts, representing 59% of total SPX volume.
- Cboe Volatility Index (VIX) options traded a total of 215.6 million contracts, with an ADV of 862 thousand contracts.
- Mini-SPX (XSP) options traded a total of 28.8 million contracts, with an ADV of 115 thousand contracts.
- Total of 28.7 million contracts traded during Cboe’s global trading hours session (8:15 PM to 9:25 AM ET), with an ADV of 115 thousand contracts.
- Quarterly ADV records set in the fourth quarter of 2025 included:
- 19.4 million contracts traded daily across Cboe’s exchanges driven by record trading in multi-list options (14.0 million) and proprietary index options (5.4 million).
- 4.3 million SPX options contracts traded daily.
- 2.6 million SPX 0DTE contracts traded daily.
- 127 thousand XSP options contracts traded daily.
- 29 of the top 30 SPX options trading days occurred in 2025, along with 24 of the top 25 days of multi-list options trading.
U.S. Equities – Off-Exchange
- BIDS Trading reported a yearly ADV record of 155.0 million matched shares, up 96% year-over-year.
European Equities
- Cboe Europe Equities reported several annual records in 2025, including:
- Record yearly Cboe Europe Equities average daily notional volume (ADNV) of €12.8 billion.
- Record yearly Cboe overall market share of 25%.
- Record yearly Cboe Periodic Auctions ADNV of €3.8 billion.
- Record yearly Cboe BIDS Europe ADNV of €614 million.
Global FX
- Global FX reported multiple records for full year 2025, including:
- Spot ADNV of $49.7 billion, surpassing last year’s record of $45.4 billion.
- Cboe SEF (Swap Execution Facility) Non-Deliverable Forwards ADNV record of $3.1 billion.
Fourth-Quarter 2025 RPC/Net Revenue Capture Guidance
The projected RPC/net capture metrics for the fourth quarter of 2025 are estimated, preliminary and may change. There can be no assurance that our final RPC for the three months ended December 31, 2025, will not differ materially from these projections.
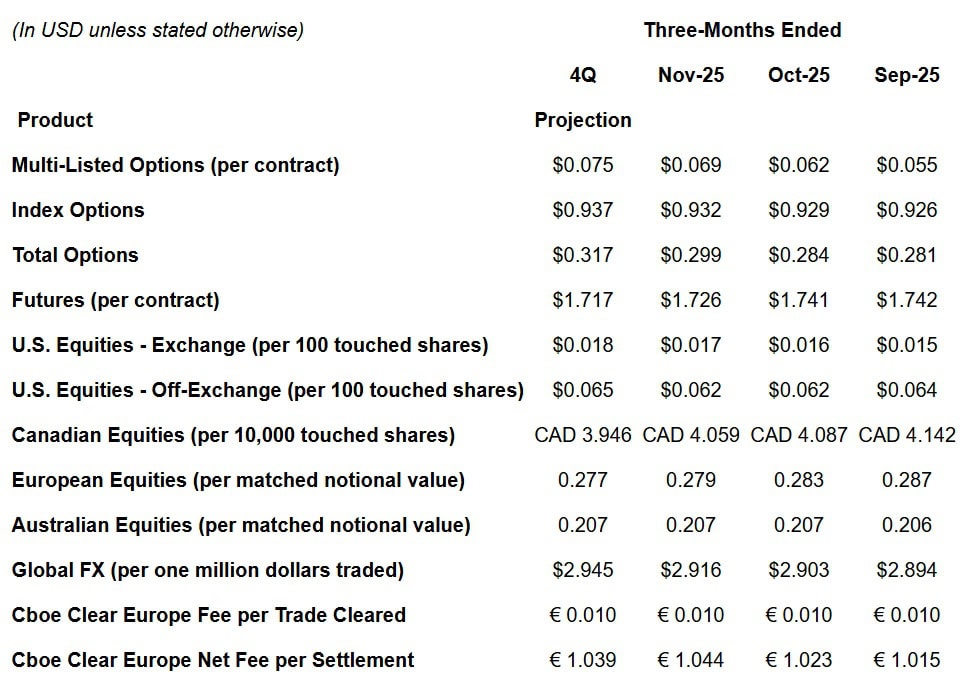
The above represents average revenue per contract (RPC) or net capture is based on a three-month rolling average, reported on a one-month lag. Average transaction fees per contract can be affected by various factors, including exchange fee rates, volume-based discounts and transaction mix by contract type and product type.
- For Options and Futures, the average RPC represents total net transaction fees recognized for the period divided by total contracts traded during the period for options exchanges: BZX Options, Cboe Options, C2 Options and EDGX Options; futures include contracts traded on Cboe Futures Exchange, LLC (CFE).
- For U.S. Equities, “net capture per 100 touched shares” refers to transaction fees less liquidity payments and routing and clearing costs divided by the product of one-hundredth ADV of touched shares on BZX, BYX, EDGX and EDGA and the number of trading days for the period.
- For U.S. Equities – Off-Exchange, “net capture per 100 touched shares” refers to transaction fees less OMS/EMS costs and clearing costs divided by the product of one-hundredth ADV of touched shares on BIDS Trading and the number of trading days for the period.
- For Canadian Equities, “net capture per 10,000 touched shares” refers to transaction fees divided by the product of one-ten thousandth ADV of shares for Cboe Canada and the number of trading days for the period and includes revenue.
- For European Equities, “net capture per matched notional value” refers to transaction fees less liquidity payments in British pounds divided by the product of ADNV in British pounds of shares matched on Cboe Europe Equities and the number of trading days.
- For Australian Equities, “net capture per matched notional value” refers to transaction fees less trading fee relief in Australian Dollars divided by the product of ADNV in Australian Dollars of shares matched on Cboe Australia and the number of trading days.
- For Global FX, “net capture per one million dollars traded” refers to transaction fees less liquidity payments, if any, divided by the Spot and SEF products of one-thousandth of ADNV traded on the Cboe FX Markets and the number of trading days, divided by two, which represents the buyer and seller that are both charged on the transaction.
- For Cboe Clear Europe, “Fee per Trade Cleared” refers to clearing fees divided by number of non-interoperable trades cleared and “Net Fee per Settlement” refers to settlement fees less direct costs incurred to settle divided by the number of settlements executed after netting.